Tafara Mtutu ECONOMICS has traditionally relied on measures, such as, gross domestic product (GDP) and GDP per capita as a measure of an economy’s growth as well as level of well-being.
While these metrics have, to some extent, painted a holistic picture of the current state of the economy, the metric alone does not paint a complete picture of an economy’s prospects.
In addition, the high level of aggregation of data presents limitations to the effectiveness of policy formulation, especially for frontier markets like Zimbabwe.
Zimbabwe’s real GDP growth is expected to slow down in 2022 by several economic research agencies. The International Monetary Fund (IMF) estimates that the country’s growth will slow down from 6,3% in 2021 to 3,5% in 2022, while Fitch anticipates weaker growth of 3,7% in 2022, down from 4,7% in 2021.
The country’s Ministry of Finance and Economic Development remains bullish with a real GDP growth estimate of 5,5% for 2022, albeit lower than 2021’s growth rate of 7,8%.
However, a quick stroll in Harare reveals sprawling residential and commercial property developments, for example, that make one wonder whether this metric alone takes all developments in the country into consideration.
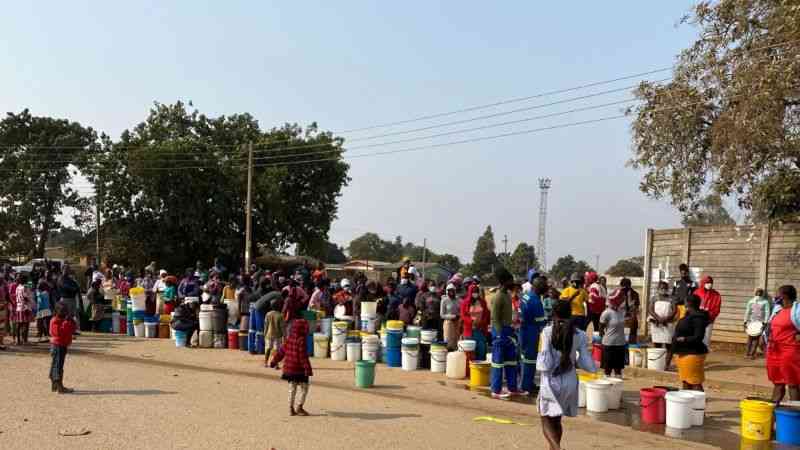
The country is also one of the most informalised nations in the world, and the thriving shadow economy is largely excluded from the building blocks of GDP.
The Reserve Bank of Zimbabwe (RBZ) governor, John Mangudya also estimated that millions of US dollars exchange hands in the informal economy.
- Chamisa under fire over US$120K donation
- Mavhunga puts DeMbare into Chibuku quarterfinals
- Pension funds bet on Cabora Bassa oilfields
- Councils defy govt fire tender directive
Keep Reading
Imports, an important component of GDP, largely exclude the influx of unquantified illegal imports through the country’s porous borders every year.
In addition, illegal exports which are not included in GDP, such as smuggled gold, amount to over US$1,5 billion and account for roughly 6% of the country’s latest official GDP figure of US$24,1 billion.
These are but a few points that point to the inefficiency of relying on GDP alone as a proxy for the country’s growth and wellbeing.
We also consider how disaggregated data can enhance policy effectiveness in Zimbabwe, using an income tax perspective as an example.
Implementing policy strictly based on aggregate data can result in inefficient standard income taxes that could be improved by implementing progressive tax bands in line with the disaggregated distribution of income on the spectrum of low to high income earners.
Zimbabwe’s latest tax bands are progressive and append a 20% income tax for annual income between ZW$300 001 (US$886) and ZW$720,000 (US$2 127).
However, the static nature of the tax brackets versus the relatively more frequent adjustments to salaries in the country means that incomes moving into the ZW$300,001 – ZW$720,000 bracket are burdened with a 20% income tax rate amid a loss in the real value of incomes.
Further, incorporating the poverty datum line (PDL), which rose to ZW$8,366 (US$24,71) per person in April 2022, could merit a case for implementing income taxes based on disposable incomes calculated as the difference between taxable income and the PDL for an average family of five.
By doing so, the average citizen is relieved from paying punitive taxes amid value erosion and rising daily costs.
There are several other data sets that can be used to disaggregate data and enhance policy effectiveness. The data sets are mostly classified along the spectrum of leading to lagging indicators.
Leading economic indicators are often considered when building a response to economic developments while lagging indicators are often considered when evaluating the impact of policy measures.
According to Investopedia, a leading indicator is any measurable or observable variable of interest that predicts a change or movement in another data series, process, trend, or other phenomenon of interest before it occurs.
Lagging indicators, on the other hand, are statistics are compiled after an economic event. Out of interest, GDP is regarded as a coincident indicator, which are indicators that occur during an economic event with providing insights on the future or the past.
Common leading indicators include jobless claims, purchasing managers’ index (PMI), the yield curve, building permits approved.
Trends in these indicators often paint a compelling story of the economic future of an economy and they often influence policy. CPI is a common lagging indicator that policy makers are measured against.
We opine that, in Zimbabwe, the parallel market rate, gold price expectations, and rainfall pattern forecasts by SARCOF can be used as leading economic indicators together with lagging indicators such as grain deliveries to the Grain Marketing Board (GMB) and local CPI growth in ascertaining the direction of the economy.
While the parallel market rate is unorthodox, it finds its merit in the fact that it is the next best variable that incorporates the shadow economy’s activities that now operate in the US$.
A fast depreciation of the local currency poses mixed implications which can be clarified by other leading and lagging indicators.
For example, the depreciation of the local currency coupled with strong prices for gold and grain deliveries to the GMB could indicate strong future growth and high demand-driven inflation, while local currency depreciation amid mooted minerals price movements and low GMB deliveries, as is the current state, fans fears of stagflation driven by imported inflation.
- Mtutu is a research analyst at Morgan & Co. — [email protected] or +263 774 795 854